
It’s OK to Get Stressed Out with OpenAM

Contents
In fact, it’s HIGHLY recommended….
Performance testing and stress testing are closely related and are essential tasks in any OpenAM deployment.

When conducting performance testing, you are trying to determine how well your system performs when subjected to a particular load. A primary goal of performance testing is to determine whether the system that you just built can support your client base (as defined by your performance requirements). Oftentimes you must tweak things (memory, configuration settings, hardware) in order to meet your performance requirements, but without executing performance tests, you will never know if you can support your clients until you are actually under fire (and by then, it may be too late).
Performance testing is an iterative process as shown in the following diagram:
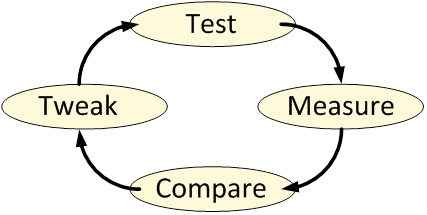
Each of the states may be described as follows:
- Test – throw a load at your server
- Measure – take note of the results
- Compare – compare your results to those desired
- Tweak – modify the system to help achieve your performance results
During performance testing you may continue in this loop until such time that you meet your performance requirements – or until you find that your requirements were unrealistic in the first place.
Stress testing (aka “torture testing”) goes beyond normal performance testing in that the load you place on the system intentionally exceeds the anticipated capacity. The goal of stress testing is to determine the breaking point of the system and observe the behavior when the system fails.

Stress testing allows you to create contingency plans for those ‘worse case scenarios’ that will eventually occur (thanks to Mr. Murphy).
Before placing OpenAM into production you should test to see if your implementation meets your current performance requirements (concurrent sessions, authentications per second, etc.) and have a pretty good idea of where your limitations are. The problem is that an OpenAM deployment is comprised of multiple servers – each that may need to be tested (and tuned) separately. So how do you know where to start?
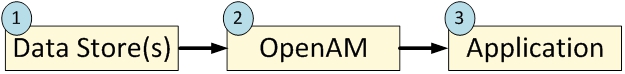
When executing performance and stress tests in OpenAM, there are three areas where I like to place my focus: 1) the protected application, 2) the OpenAM server, and 3) the data store(s). Testing the system as a whole may not provide enough information to determine where problems may lie and so I prefer to take an incremental approach that tests each component in sequence. I start with the data stores (authentication and user profile databases) and work my way back towards the protected application – with each iteration adding a new component.
Note: It should go without saying that the testing environment should mimic your production environment as closely as possible. Any deviation may cause your test results to be skewed and provide inaccurate data.
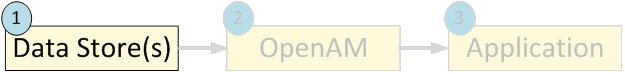
Data Store(s)
An OpenAM deployment may consist of multiple data stores – those that are used for authentication (Active Directory, OpenDJ, Radius Server, etc.) and those that are used to build a user’s profile (LDAP and RDBMS). Both of these are core to an OpenAM deployment and while they are typically the easiest to test, a misconfiguration here may have a pretty big impact on overall performance. As such, I start my testing at the database layer and focus only on that component.
Performance of an authentication database can be measured by the average number of authentications that occur over a particular period of time (seconds, minutes, hours) and the easiest way to test these types of databases is to simply perform authentication operations against them.
You can write your own scripts to accomplish this, but there are many freely available tools that can be used as well. One tool that I have used in the past is the SLAMD Distributed Load Generation Engine. SLAMD was designed to test directory server performance, but it can be used to test web applications as well. Unfortunately, SLAMD is no longer being actively developed, but you can still download a copy from http://dl.thezonemanager.com/slamd/.
A tool that I have started using to test authentications against an LDAP server is authrate, which is included in ForgeRock’s OpenDJ LDAP Toolkit. Authrate allows you to stress the server and display some really nice statistics while doing so. The authrate command line tool measures bind throughput and response times and is perfect for testing all sorts of LDAP authentication databases.
Performance of a user profile database is typically measured in search performance against that database. If your user profile database can be searched using LDAP (i.e. Active Directory or any LDAPv3 server), then you can use searchrate – also included in the OpenDJ LDAP Toolkit. searchrate is a command line tool that measures search throughput and response time.
The following is sample output from the searchrate command:
-------------------------------------------------------------------------------
     Throughput                            Response Time
   (ops/second)                           (milliseconds)
recent  average  recent  average  99.9%  99.99%  99.999%  err/sec  Entries/Srch
-------------------------------------------------------------------------------
 188.7    188.7   3.214    3.214  306.364 306.364  306.364    0.0           0.0
 223.1    205.9   2.508    2.831  27.805  306.364  306.364    0.0           0.0
 245.7    219.2   2.273    2.622  20.374  306.364  306.364    0.0           0.0
 238.7    224.1   2.144    2.495  27.805  306.364  306.364    0.0           0.0
 287.9    236.8   1.972    2.368  32.656  306.364  306.364    0.0           0.0
 335.0    253.4   1.657    2.208  32.656  306.364  306.364    0.0           0.0
 358.7    268.4   1.532    2.080  30.827  306.364  306.364    0.0           0.0
The first two columns represent the throughput (number of operations per second) observed in the server. The first column contains the most recent value and the second column contains the average throughput since the test was initiated (i.e. the average of all values contained in column one).
The remaining columns represent response times with the third column being the most recent response time and the fourth column containing the average response time since the test was initiated. Columns five, six, and seven (represented by percentile headers) demonstrate how many operations fell within that range.
For instance, by the time we are at the 7th row, 99.9% of the operations are completed in 30.827 ms (5th column, 7th row), 99.99% are completed in 306.364 ms (6th column, 7th row), and 99.999% of them are completed within 306.364 ms (7th column, 7th row). The percentile rankings provide a good indication of the real system performance and can be interpreted as follows:
- 1 out of 1,000 search requests is exceeding 30 ms
- 1 one out of 100,000 requests is exceeding 306 ms
Note: The values contained in this search were performed on an untuned, limited resource test system. Results will vary depending on the amount of JVM memory, the system CPU(s), and the data contained in the directory. Generally, OpenDJ systems can achieve much better performance that the values shown above.
There are several factors that may need to be considered when tuning authentication and user profile databases. For instance, if you are using OpenDJ for your database you may need to modify your database cache, the number of worker threads, or even how indexing is configured in the server. If your constraint is operating system based, you may need to increase the size of the JVM or the number of file descriptors. If the hardware is the limiting factor, you may need to increase RAM, use high speed disks, or even faster network interfaces. No matter what the constraint, you should optimize the databases (and database servers) before moving up the stack to the OpenAM instance.
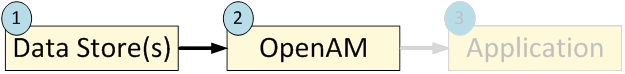
OpenAM Instance + Data Store(s)
Once you have optimized any data store(s) you can now begin testing directly against OpenAM as it is configured against those data store(s). Previous testing established a performance baseline and any degradation introduced at this point will be due to OpenAM or the environment (operating system, Java container) where it has been configured.
But how can you test an OpenAM instance without introducing the application that it is protecting? One way is to generate a series of authentications and authorizations using direct interfaces such as the OpenAM API or REST calls. I prefer to use REST calls as this is the easiest to implement.
There are browser based applications such as Postman that are great for functional testing, but these are not easily scriptable. As such, I lean towards a shell or Perl script containing a loop of cURL commands.
Note: You should use the same authentication and search operations in your cURL commands to be sure that you are making a fair comparison between the standalone database testing and the introduction of OpenAM.
You should expect some decrease in performance when the OpenAM server is introduced, but it should not be too drastic. If you find that it falls outside of your requirements, however, then you should consider updating OpenAM in one of the following areas:
- LDAP Configuration Settings (i.e. connections to the Configuration Server)
- Session Settings (if you are hitting limitations)
- JVM Settings (pay particular attention to garbage collection)
- Cache Settings (size and time to live)
Details behind each of these areas can be found in the OpenAM Administration Guide.
You may also find that OpenAM’s interaction with the database(s) introduces searches (or other operations) that you did not previously test for. This may require you to update your database(s) to account for this and restart your performance testing.
Note: Another tool I have started playing with is the Java Application Monitor (aka JAMon). While this tool is typically used to monitor a Java application, it provides some useful information to help determine bottlenecks working with databases, file IO, and garbage collection.
Application + OpenAM Instance + Data Store(s)
Once you feel comfortable with the performance delivered by OpenAM and its associated data store(s), it is time to introduce the final component – the protected application, itself.
This will differ quite a bit based on how you are protecting your application (for instance, policy agents will behave differently from OAuth2/OpenID Connect or SAML2) but this does provide you with the information you need to determine if you can meet your performance requirements in a production deployment.
If you have optimized everything up to this point, then the combination of all three components will provide a full end to end test of the entire system. In this case, then an impact due to network latency will be the most likely factor in performance testing.
To perform a full end to end test of all components, I prefer to use Apache JMeter. You configure JMeter to use a predefined set of credentials, authenticate to the protected resource, and look for specific responses from the server. Once you see those responses, JMeter will act according to how you have preconfigured it to act. This tool allows you to generate a load against OpenAM from login to logout and anything in between.
Other Considerations
Keep in mind that any time that you introduce a monitoring tool into a testing environment, the tool (itself) can impact performance. So while the numbers you receive are useful, they are not altogether acurate. There may be some slight performance degradation (due to the introduction of the tool) that your users will never see.
You should also be aware that the client machine (where the load generation tools are installed) may become a bottleneck if you are not careful. You should consider distributing your performance testing tools across multiple client machines to minimize this effect. This is another way of ensuring that the client environment does not become the limiting factor.
Summary
Like many other areas in our field, performance testing an OpenAM deployment may be considered as much of an art as it is a science. There may be as many methods for testing as there are consultants and each varies based on the tools they use. The information contained here is just one approach performance testing – one that I have used successfully in our deployments.